Prometheus and Grafana
YuniKorn exposes its scheduling metrics via Prometheus. Thus, we need to set up a Prometheus server to collect these metrics.
We will provide two methods for building Prometheus: either running it locally or using Helm to deploy it in your cluster. Additionally, in the Helm version, we will explain how to integrate it with Grafana and provide generic Grafana Dashboards for monitoring Yunikorn's metrics and observing the changes over time.
If you don't know what metric can be used, you can use REST API.
Run Prometheus locally
1. Download Prometheus release
wget https://github.com/prometheus/prometheus/releases/download/v2.30.3/prometheus-2.30.3.linux-amd64.tar.gz
tar xvfz prometheus-*.tar.gz
cd prometheus-*
2. Configure prometheus.yml
Prometheus collects metrics from targets by scraping metrics HTTP endpoints.
global:
  scrape_interval:     3s
  evaluation_interval: 15s

scrape_configs:
  - job_name: 'yunikorn'
    scrape_interval: 1s
    metrics_path: '/ws/v1/metrics'
    static_configs:
    - targets: ['localhost:9080']
    # 9080 is internal port, need port forward or modify 9080 to service's port
3. Start port-forward
Port forwarding for the core's web service on the standard port can be turned on via:
kubectl port-forward svc/yunikorn-service 9080:9080 -n yunikorn
9080is the default port for core's web service.
4. Execute prometheus
./prometheus --config.file=prometheus.yml
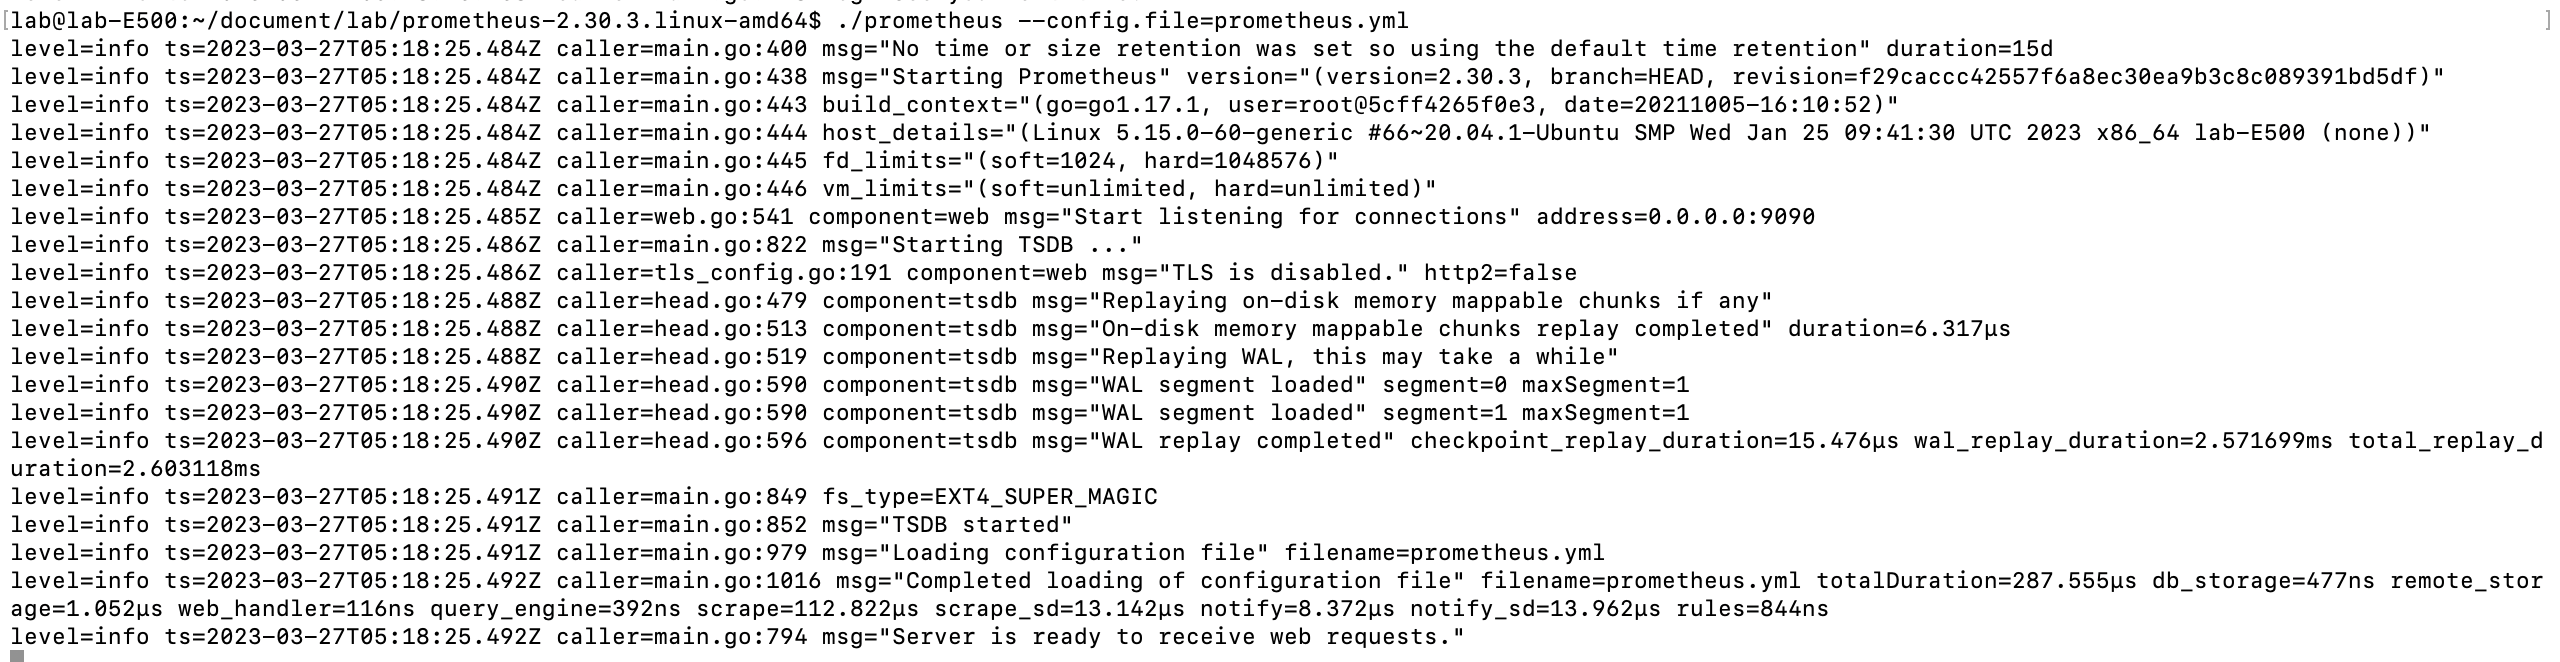
5. Access the Prometheus UI
You should be able to browse to a status page at localhost:9090. Give it a couple of seconds to collect data about itself from its own HTTP metrics endpoint.
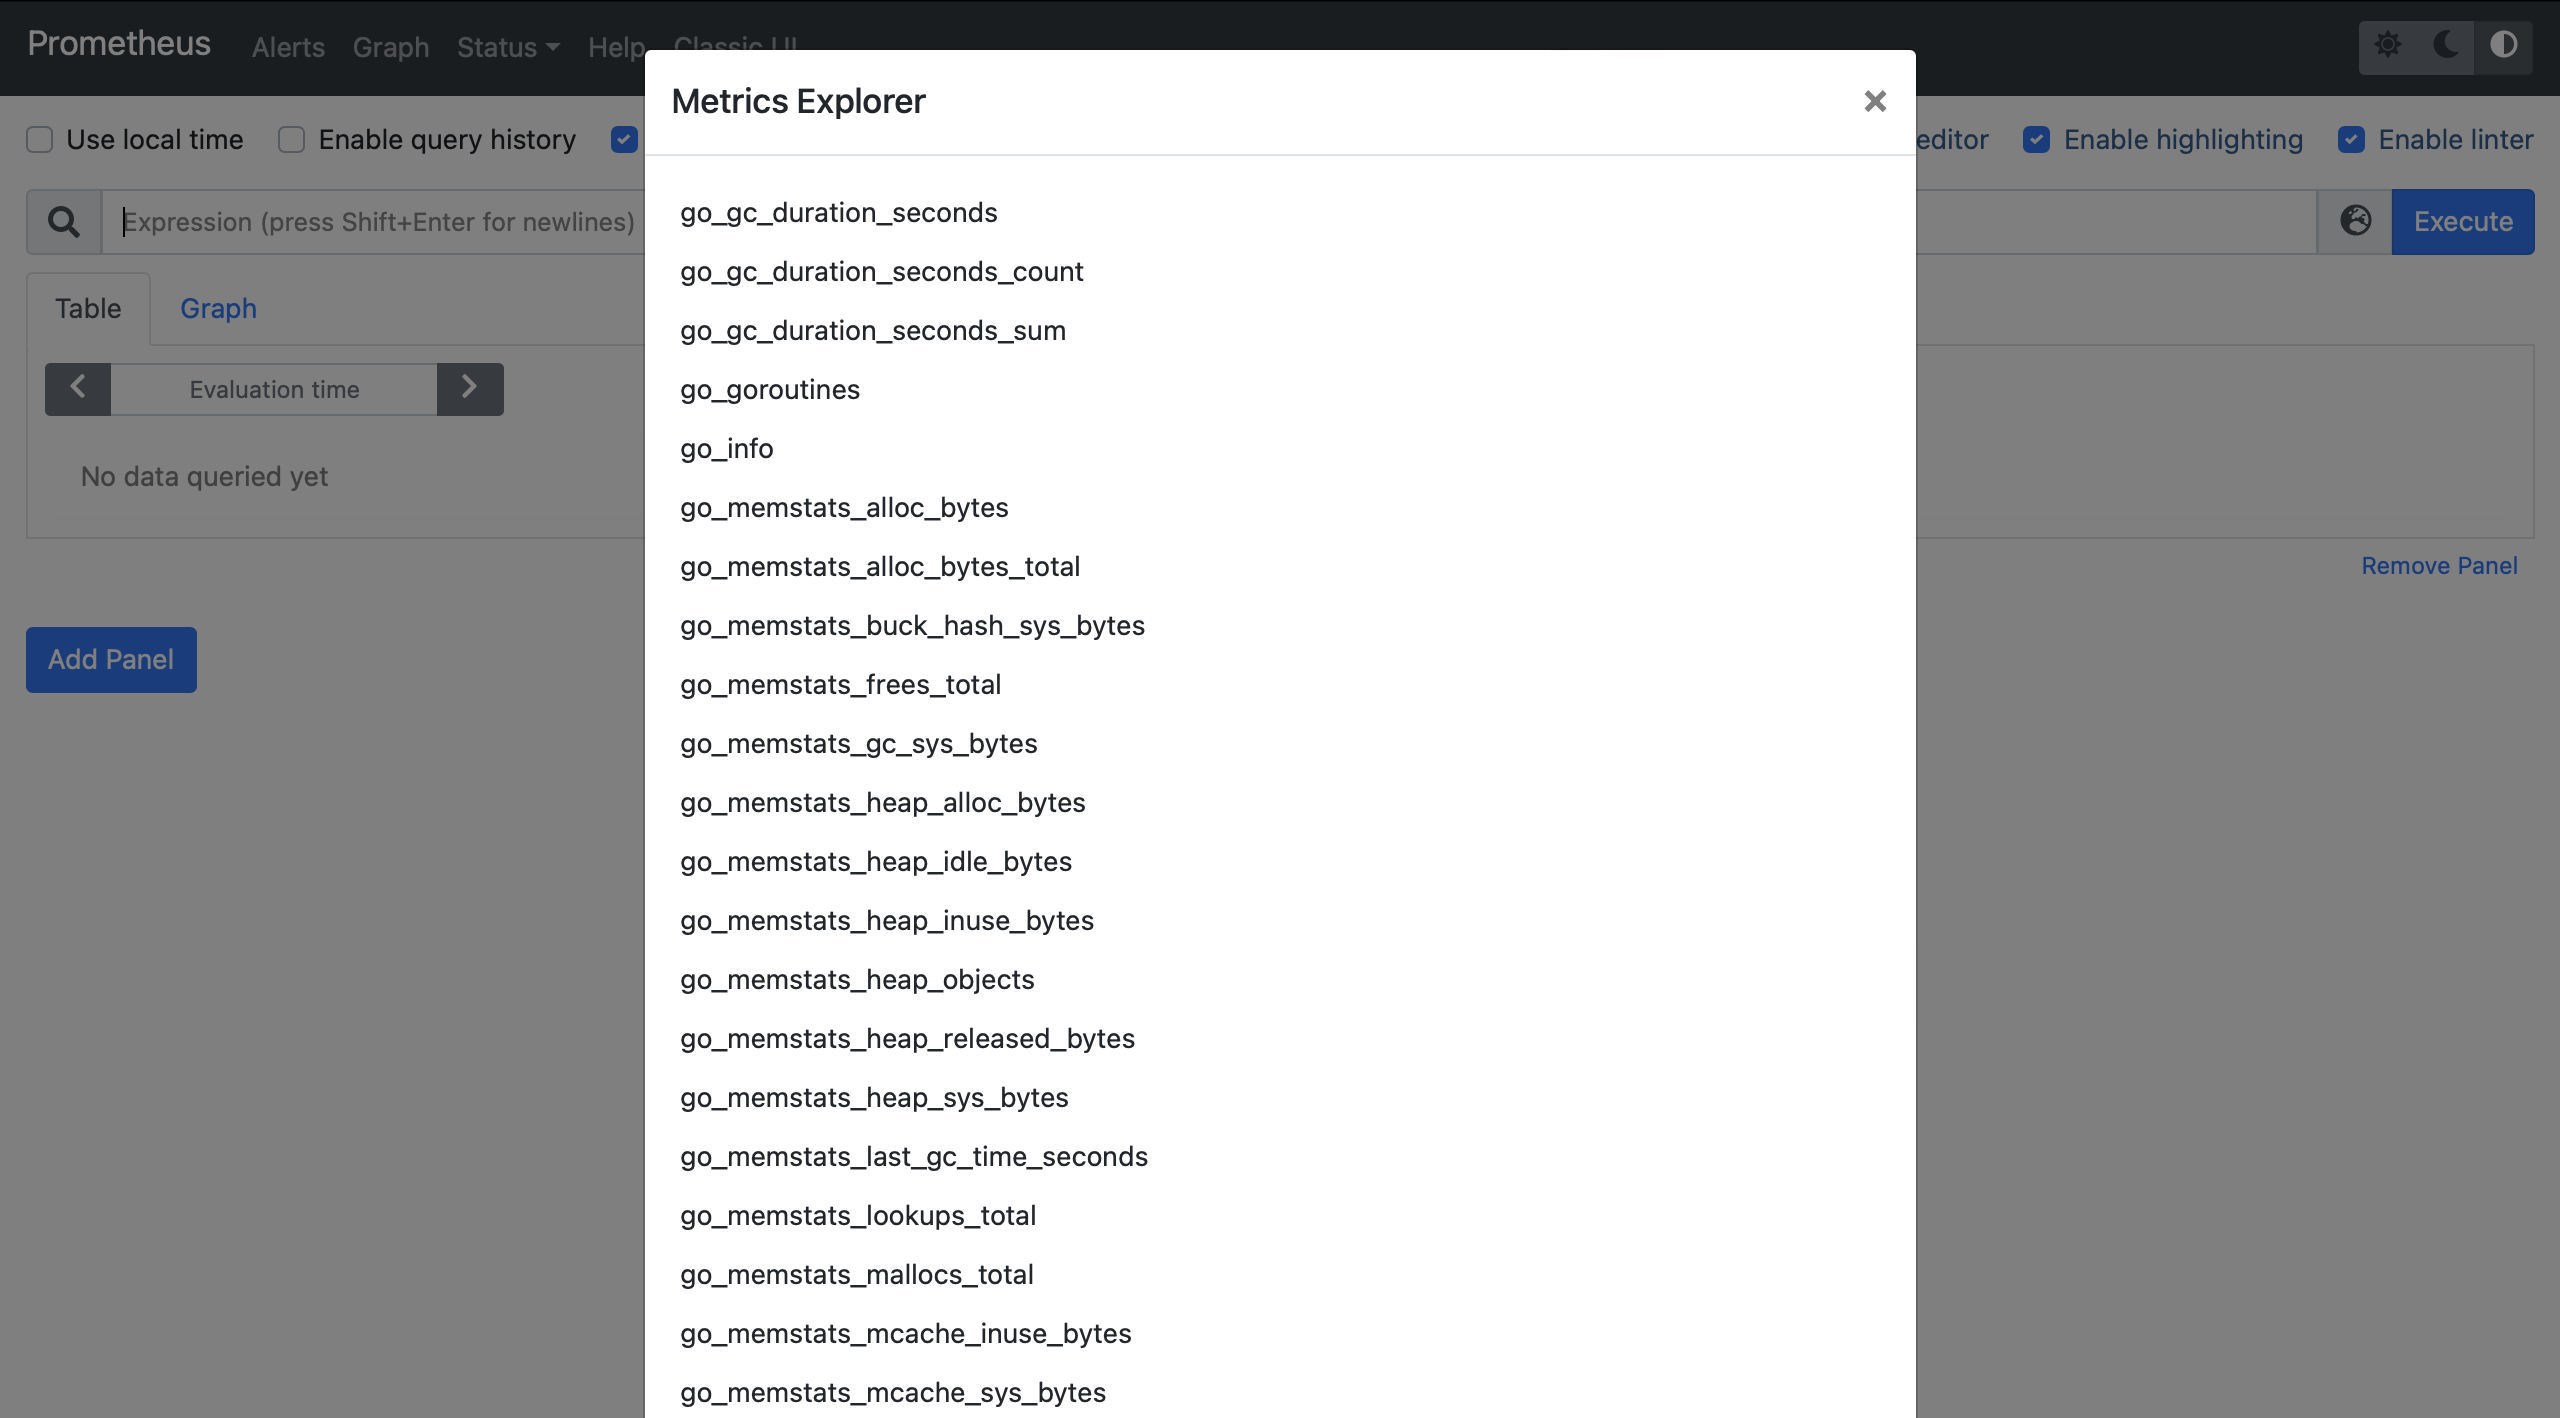
You can also verify that Prometheus is serving metrics by navigating to its metrics endpoint:localhost:9090/metrics
Deploy Prometheus and Grafana in a cluster.
1. Add Prometheus repository to helm
# add helm repo
helm repo add prometheus-community https://prometheus-community.github.io/helm-charts
helm repo update
2. Configuring yunikorn for prometheus
Get the config from repository.
helm show values prometheus-community/kube-prometheus-stack > /tmp/values.yaml
Add a new job in Prometheus to collect metrics by scraping the metrics HTTP endpoints of the targets.
vim /tmp/values.yaml
...
additionalScrapeConfigs:
  - job_name: "yunikorn"
    scrape_interval: 1s
    metrics_path: '/ws/v1/metrics'
    static_configs:
      - targets: ["yunikorn-service.yunikorn.svc.cluster.local:9080"]
...
3. Use helm to create Prometheus
# create k8s namespace
kubectl create namespace prometheus

# deploy chart
helm install prometheus prometheus-community/kube-prometheus-stack -n prometheus -f /tmp/values.yaml
4. Access the Prometheus Web UI
kubectl port-forward -n prometheus svc/prometheus-kube-prometheus-prometheus 9090:9090
After running port-forward, you can enter localhost:9090 to access Prometheus Web UI.
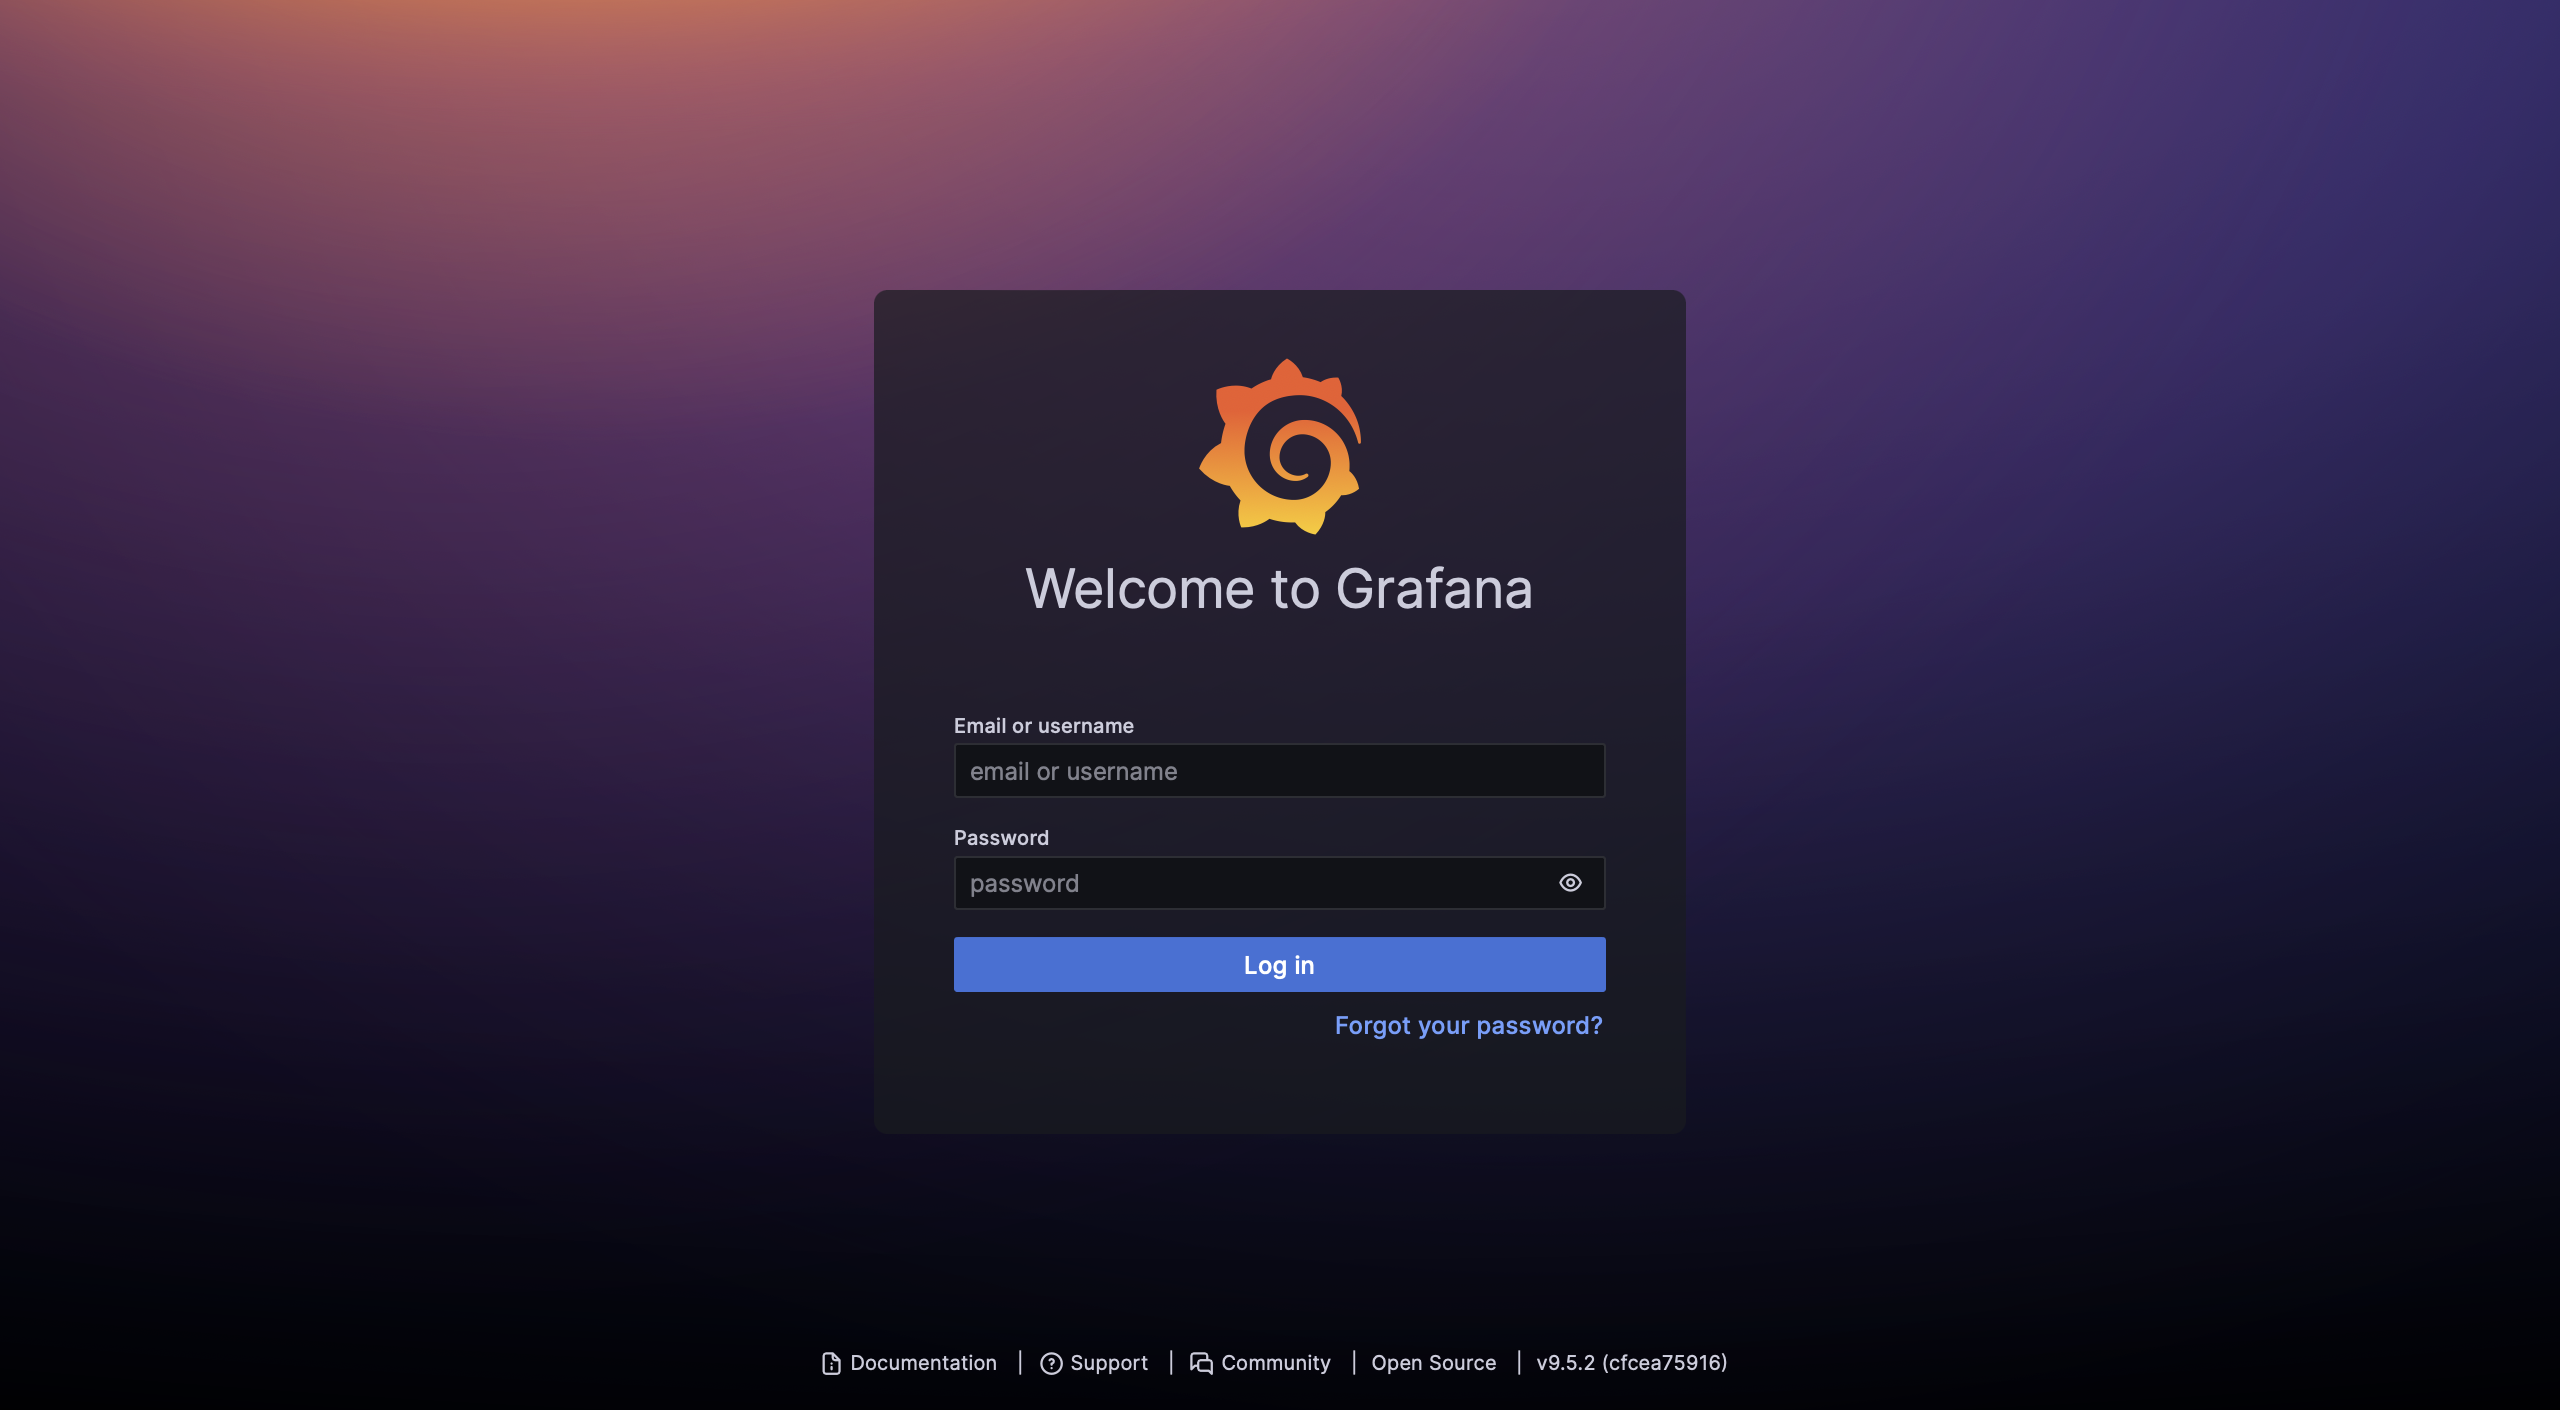
Access Grafana Dashboard
Port forwarding for the Grafana web service on the standard port can be turned on via:
kubectl port-forward -n prometheus svc/prometheus-grafana 7070:80
After running port-forward, you can enter localhost:7070 to access grafana, and in the login page, enter account:admin ,password:prom-operator.
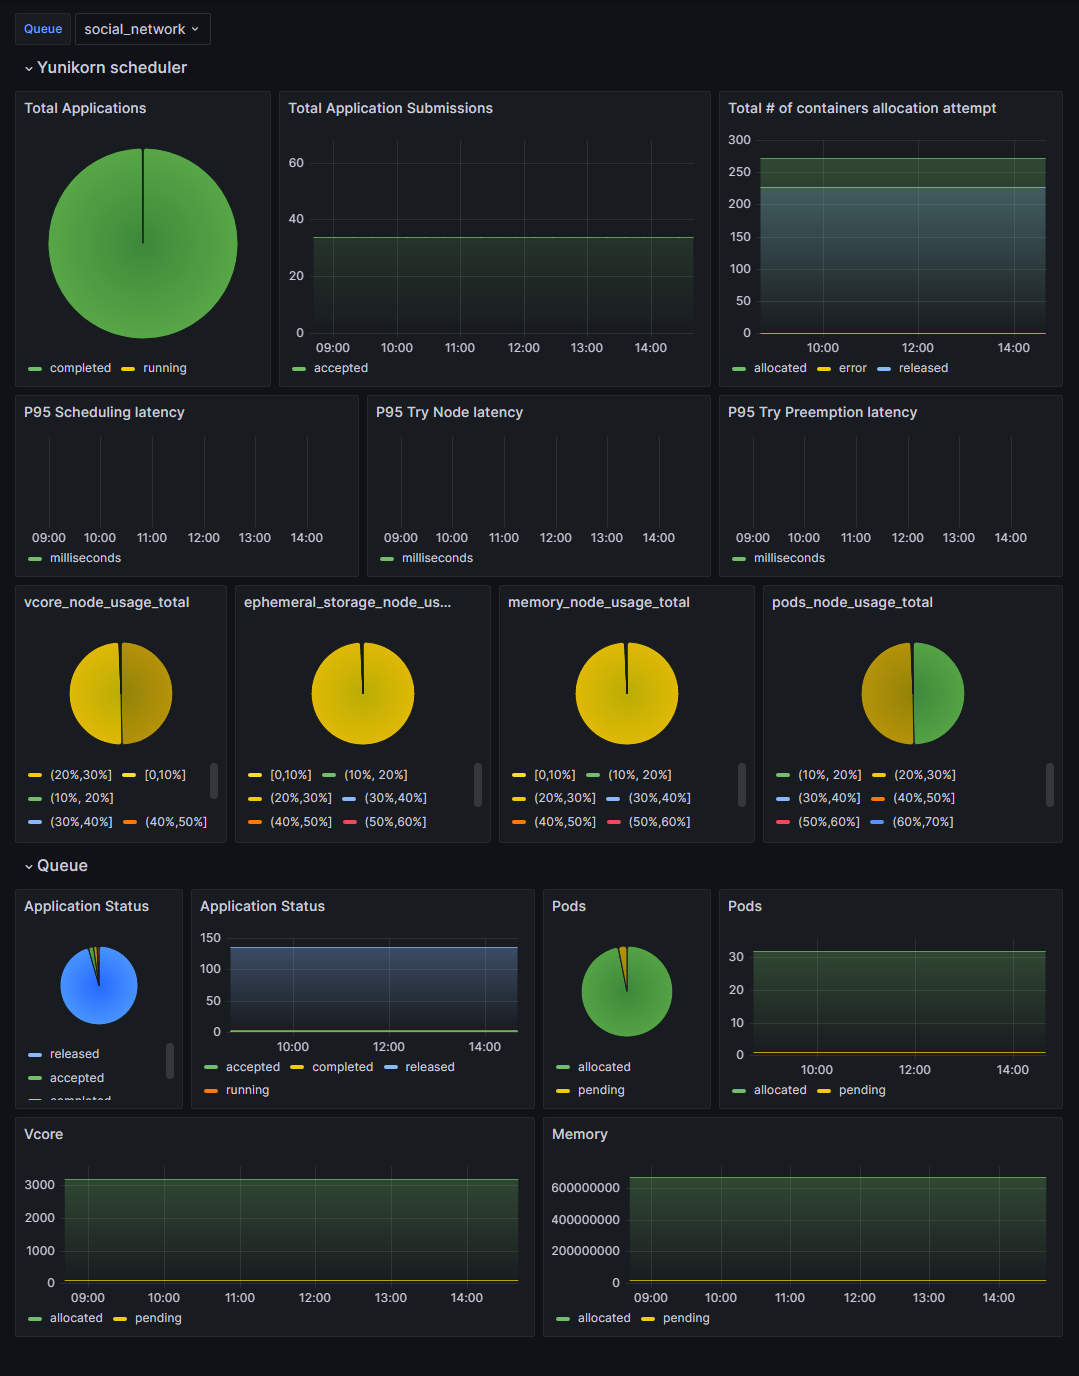
Download JSON files for Yunikorn Dashboard
A dashboard consists of multiple panels that are organized and arranged in rows. Each panel has the ability to interact with data from any Grafana data source that has been configured. For more detailed information, please refer to the Grafana Dashboards.
We provide a sample dashboard JSON file. To access it, you can navigate to the /deployments/grafana-dashboard directory in the Yunikorn-k8shim repository.
You can refer to the REST API to build your own custom Dashboard.
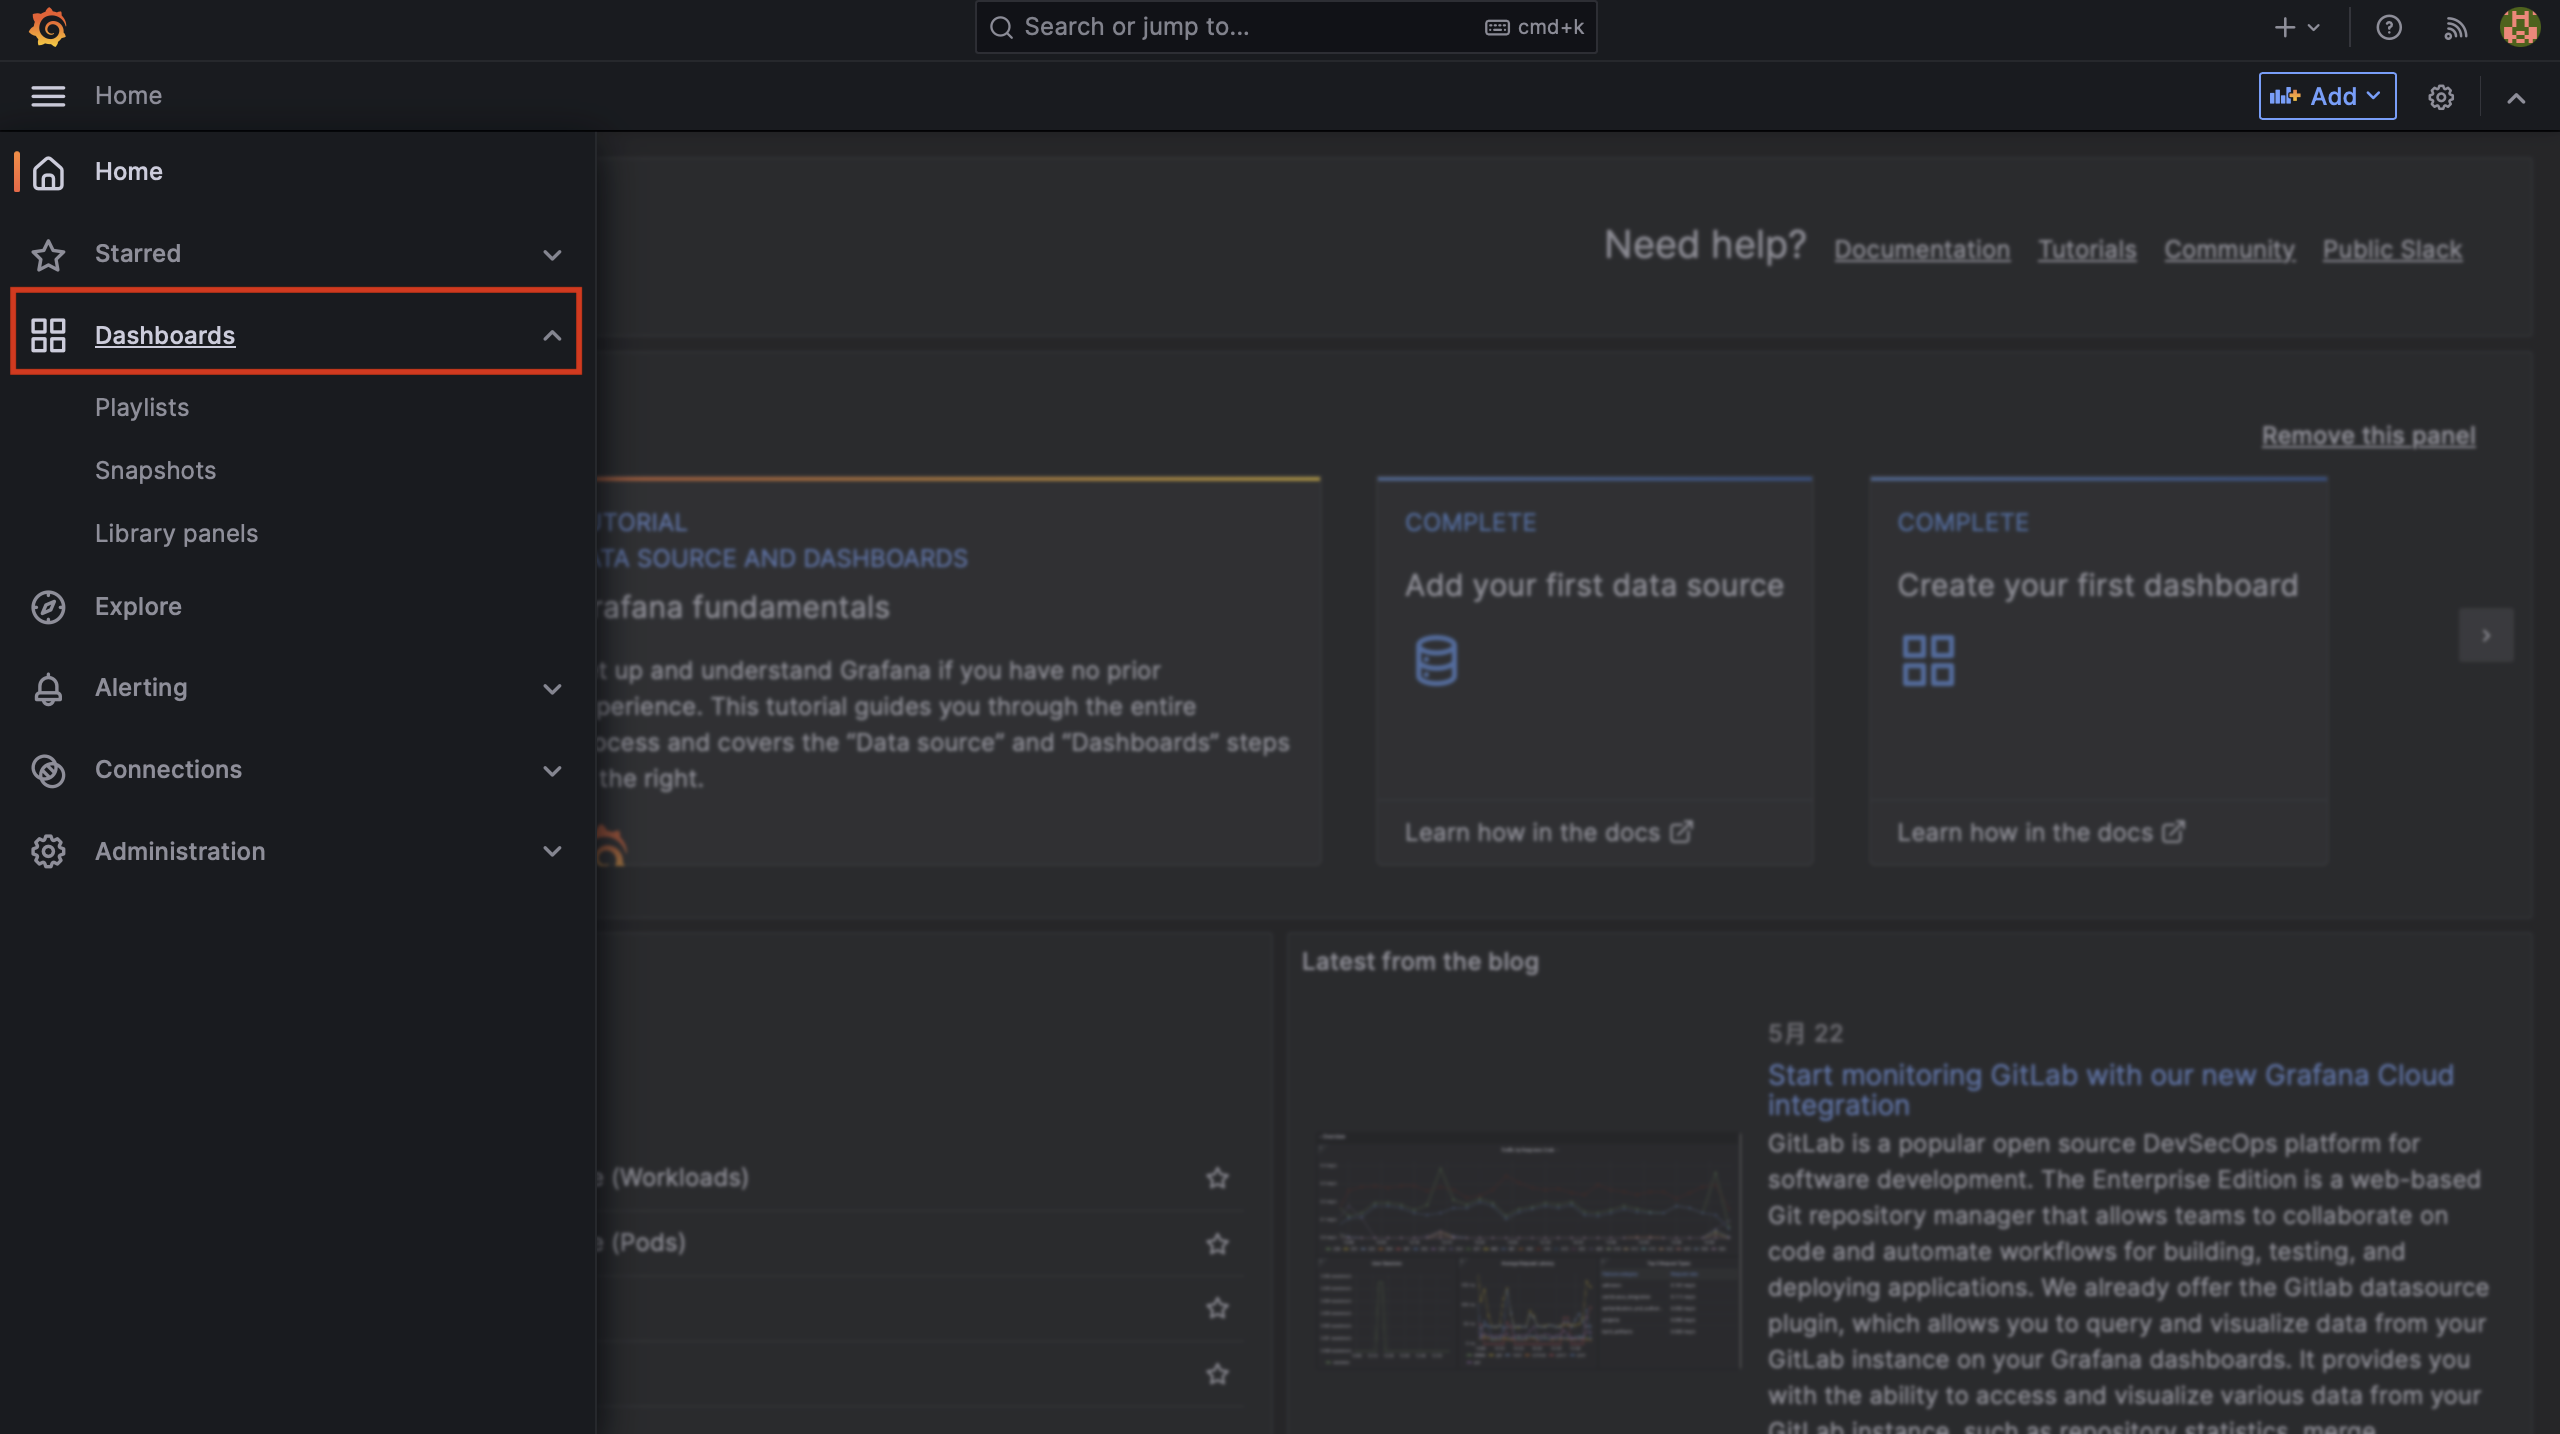
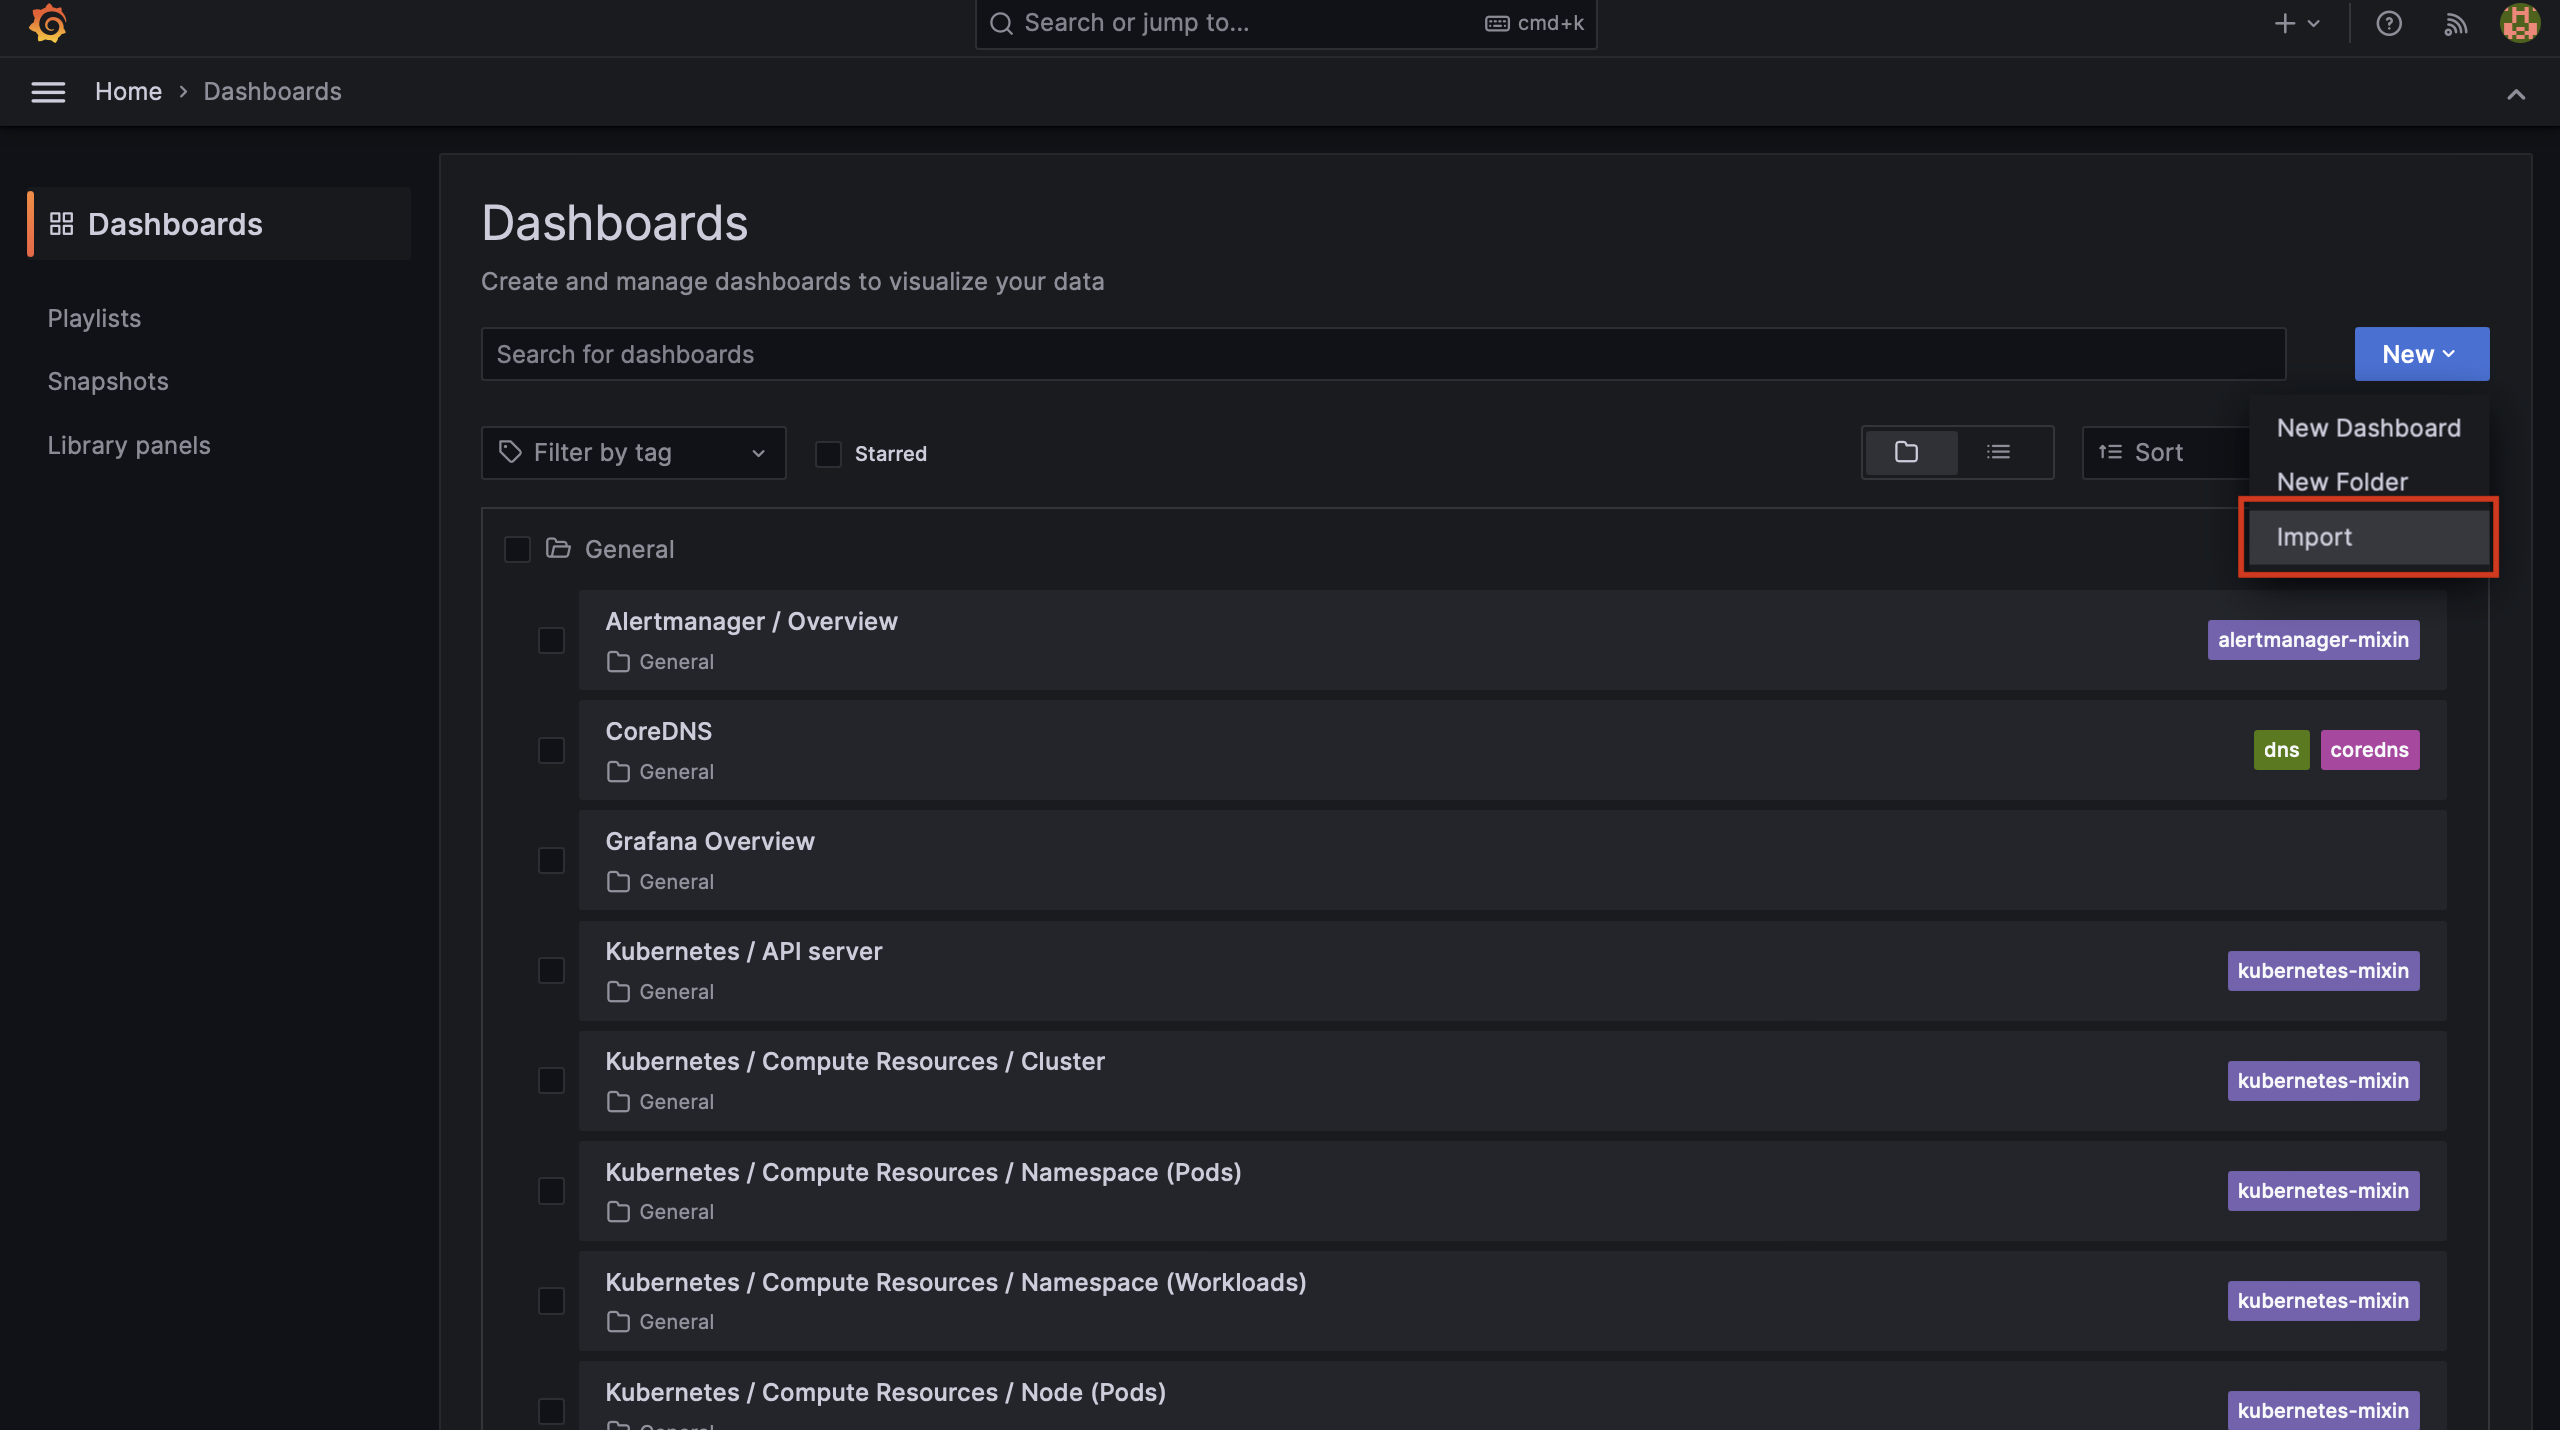
Import the JSON files in the Dashboard
Once you access the Dashboard page, you can proceed to import the provided JSON file.
Once the import is complete, you will be able to locate Yunikorn's Dashboard on the page. From there, you can regularly monitor the status of Yunikorn.