Benchmarking Tutorial
Overview
The YuniKorn community continues to optimize the performance of the scheduler, ensuring that YuniKorn satisfies the performance requirements of large-scale batch workloads. Thus, the community has built some useful tools for performance benchmarking that can be reused across releases. This document introduces all these tools and steps to run them.
Hardware
Be aware that performance result is highly variable depending on the underlying hardware. All results published in the doc can only be used as references. We encourage each individual to run similar tests on their own environments in order to get a result based on your own hardware. This doc is just for demonstration purpose.
A list of servers being used in this test are (Huge thanks to National Taichung University of Education, Kuan-Chou Lai for providing these servers for running tests):
| Manchine Type | CPU | Memory | Download/upload(Mbps) |
|---|---|---|---|
| HP | 16 | 36G | 525.74/509.86 |
| HP | 16 | 30G | 564.84/461.82 |
| HP | 16 | 30G | 431.06/511.69 |
| HP | 24 | 32G | 577.31/576.21 |
| IBM blade H22 | 16 | 38G | 432.11/4.15 |
| IBM blade H22 | 16 | 36G | 714.84/4.14 |
| IBM blade H22 | 16 | 42G | 458.38/4.13 |
| IBM blade H22 | 16 | 42G | 445.42/4.13 |
| IBM blade H22 | 16 | 32G | 400.59/4.13 |
| IBM blade H22 | 16 | 12G | 499.87/4.13 |
| IBM blade H23 | 8 | 32G | 468.51/4.14 |
| WS660T | 8 | 16G | 87.73/86.30 |
| ASUSPRO D640MB_M640SA | 4 | 8G | 92.43/93.77 |
| PRO E500 G6_WS720T | 16 | 8G | 90/87.18 |
| WS E500 G6_WS720T | 8 | 40G | 92.61/89.78 |
| E500 G5 | 8 | 8G | 91.34/85.84 |
| WS E500 G5_WS690T | 12 | 16G | 92.2/93.76 |
| WS E500 G5_WS690T | 8 | 32G | 91/89.41 |
| WS E900 G4_SW980T | 80 | 512G | 89.24/87.97 |
The following steps are needed for each server, otherwise the large scale testing may fail due to the limited number of users/processes/open-files.
1. Set /etc/sysctl.conf
kernel.pid_max=400000
fs.inotify.max_user_instances=50000
fs.inotify.max_user_watches=52094
2. Set /etc/security/limits.conf
* soft nproc 4000000
* hard nproc 4000000
root soft nproc 4000000
root hard nproc 4000000
* soft nofile 50000
* hard nofile 50000
root soft nofile 50000
root hard nofile 50000
Deploy workflow
Before going into the details, here are the general steps used in our tests:
- Step 1: Properly configure Kubernetes API server and controller manager, then add worker nodes.
- Step 2: Deploy hollow pods,which will simulate worker nodes, name hollow nodes. After all hollow nodes in ready status, we need to cordon all native nodes, which are physical presence in the cluster, not the simulated nodes, to avoid we allocated test workload pod to native nodes.
- Step 3: Deploy YuniKorn using the Helm chart on the master node, and scale down the Deployment to 0 replica, and modify the port in
prometheus.ymlto match the port of the service. - Step 4: Deploy 50k Nginx pods for testing, and the API server will create them. But since the YuniKorn scheduler Deployment has been scaled down to 0 replica, all Nginx pods will be stuck in pending.
- Step 5: Scale up The YuniKorn Deployment back to 1 replica, and cordon the master node to avoid YuniKorn allocating Nginx pods there. In this step, YuniKorn will start collecting the metrics.
- Step 6: Observe the metrics exposed in Prometheus UI.
Setup Kubemark
Kubemark is a performance testing tool which allows users to run experiments on simulated clusters. The primary use case is the scalability testing. The basic idea is to run tens or hundreds of fake kubelet nodes on one physical node in order to simulate large scale clusters. In our tests, we leverage Kubemark to simulate up to a 4K-node cluster on less than 20 physical nodes.
1. Build image
Clone kubernetes repo, and build kubemark binary file
git clone https://github.com/kubernetes/kubernetes.git
cd kubernetes
KUBE_BUILD_PLATFORMS=linux/amd64 make kubemark GOFLAGS=-v GOGCFLAGS="-N -l"
Copy kubemark binary file to the image folder and build kubemark docker image
cp _output/bin/kubemark cluster/images/kubemark
IMAGE_TAG=v1.XX.X make build
After this step, you can get the kubemark image which can simulate cluster node. You can upload it to Docker-Hub or just deploy it locally.
2. Install Kubermark
Create kubemark namespace
kubectl create ns kubemark
Create configmap
kubectl create configmap node-configmap -n kubemark --from-literal=content.type="test-cluster"
Create secret
kubectl create secret generic kubeconfig --type=Opaque --namespace=kubemark --from-file=kubelet.kubeconfig={kubeconfig_file_path} --from-file=kubeproxy.kubeconfig={kubeconfig_file_path}
3. Label node
We need to label all native nodes, otherwise the scheduler might allocate hollow pods to other simulated hollow nodes. We can leverage Node selector in yaml to allocate hollow pods to native nodes.
kubectl label node {node name} tag=tagName
4. Deploy Kubemark
The hollow-node.yaml is down below, there are some parameters we can configure.
apiVersion: v1
kind: ReplicationController
metadata:
  name: hollow-node
  namespace: kubemark
spec:
  replicas: 2000  # the node number you want to simulate
  selector:
      name: hollow-node
  template:
    metadata:
      labels:
        name: hollow-node
    spec:
      nodeSelector:  # leverage label to allocate to native node
        tag: tagName
      initContainers:
      - name: init-inotify-limit
        image: docker.io/busybox:latest
        imagePullPolicy: IfNotPresent
        command: ['sysctl', '-w', 'fs.inotify.max_user_instances=200'] # set as same as max_user_instance in actual node
        securityContext:
          privileged: true
      volumes:
      - name: kubeconfig-volume
        secret:
          secretName: kubeconfig
      - name: logs-volume
        hostPath:
          path: /var/log
      containers:
      - name: hollow-kubelet
        image: 0yukali0/kubemark:1.20.10 # the kubemark image you build
        imagePullPolicy: IfNotPresent
        ports:
        - containerPort: 4194
        - containerPort: 10250
        - containerPort: 10255
        env:
        - name: NODE_NAME
          valueFrom:
            fieldRef:
              fieldPath: metadata.name
        command:
        - /kubemark
        args:
        - --morph=kubelet
        - --name=$(NODE_NAME)
        - --kubeconfig=/kubeconfig/kubelet.kubeconfig
        - --alsologtostderr
        - --v=2
        volumeMounts:
        - name: kubeconfig-volume
          mountPath: /kubeconfig
          readOnly: true
        - name: logs-volume
          mountPath: /var/log
        resources:
          requests:    # the resource of hollow pod, can modify it.
            cpu: 20m
            memory: 50M
        securityContext:
          privileged: true
      - name: hollow-proxy
        image: 0yukali0/kubemark:1.20.10 # the kubemark image you build
        imagePullPolicy: IfNotPresent
        env:
        - name: NODE_NAME
          valueFrom:
            fieldRef:
              fieldPath: metadata.name
        command:
        - /kubemark
        args:
        - --morph=proxy
        - --name=$(NODE_NAME)
        - --use-real-proxier=false
        - --kubeconfig=/kubeconfig/kubeproxy.kubeconfig
        - --alsologtostderr
        - --v=2
        volumeMounts:
        - name: kubeconfig-volume
          mountPath: /kubeconfig
          readOnly: true
        - name: logs-volume
          mountPath: /var/log
        resources:  # the resource of hollow pod, can modify it.
          requests:
            cpu: 20m
            memory: 50M
      tolerations:
      - effect: NoExecute
        key: node.kubernetes.io/unreachable
        operator: Exists
      - effect: NoExecute
        key: node.kubernetes.io/not-ready
        operator: Exists
once done editing, apply it to the cluster:
kubectl apply -f hollow-node.yaml
Deploy YuniKorn
Install YuniKorn with helm
We can install YuniKorn with Helm, please refer to this doc.
We need to tune some parameters based on the default configuration. We recommend to clone the release repo and modify the parameters in value.yaml.
git clone https://github.com/apache/yunikorn-release.git
cd helm-charts/yunikorn
Configuration
The modifications in the value.yaml are:
- increased memory/cpu resources for the scheduler pod
- disabled the admission controller
- set the app sorting policy to FAIR
please see the changes below:
resources:
  requests:
    cpu: 14
    memory: 16Gi
  limits:
    cpu: 14
    memory: 16Gi
embedAdmissionController: false
configuration: |
  partitions:
    -
      name: default
      queues:
        - name: root
          submitacl: '*'
          queues:
            -
              name: sandbox
              properties:
                application.sort.policy: fair
Install YuniKorn with local release repo
Helm install yunikorn . --namespace yunikorn
Setup Prometheus
YuniKorn exposes its scheduling metrics via Prometheus. Thus, we need to set up a Prometheus server to collect these metrics.
1. Download Prometheus release
wget https://github.com/prometheus/prometheus/releases/download/v2.30.3/prometheus-2.30.3.linux-amd64.tar.gz
tar xvfz prometheus-*.tar.gz
cd prometheus-*
2. Configure prometheus.yml
global:
  scrape_interval:     3s
  evaluation_interval: 15s

scrape_configs:
  - job_name: 'yunikorn'
    scrape_interval: 1s
    metrics_path: '/ws/v1/metrics'
    static_configs:
    - targets: ['docker.for.mac.host.internal:9080']
    # 9080 is internal port, need port forward or modify 9080 to service's port
3. Launch Prometheus
./prometheus --config.file=prometheus.yml
Run tests
Once the environment is setup, you are good to run workloads and collect results. YuniKorn community has some useful tools to run workloads and collect metrics, more details will be published here.
1. Scenarios
In performance tools, there are three types of tests and feedbacks.
| Test type | Description | Diagram | Log |
|---|---|---|---|
| node fairness | Monitor node resource usage(allocated/capicity) with lots of pods requests | Exist | Exist |
| thourghput | Measure schedulers' throughput by calculating how many pods are allocated per second based on the pod start time | Exist | None |
2. Build tool
The performance tool is available in yunikorn release repo,clone the repo to your workspace.
git clone https://github.com/apache/yunikorn-release.git
Build the tool:
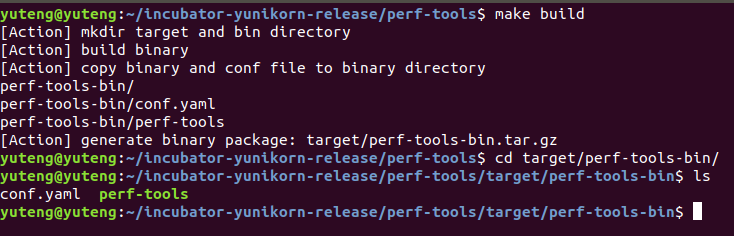
cd yunikorn-release/perf-tools/
make build
cd target/perf-tools-bin
It will look like this.
3. Set test configuration
Before start tests, check configuration whether meet your except.
Default output path is /tmp, you can modify common.outputrootpath to change it.
If you set these fields with large number to cause timeout problem, increase value in common.maxwaitseconds to allow it.
Throughput case
| Field | Description |
|---|---|
| SchedulerNames | List of scheduler will run the test |
| ShowNumOfLastTasks | Show metadata of last number of pods |
| CleanUpDelayMs | Controll period to refresh deployments status and print log |
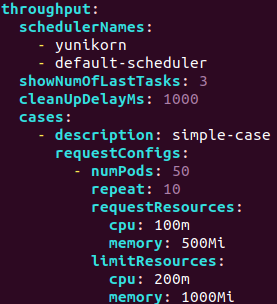
| RequestConfigs | Set resource request and decide number of deployments and pods per deployment with repeat and numPods |
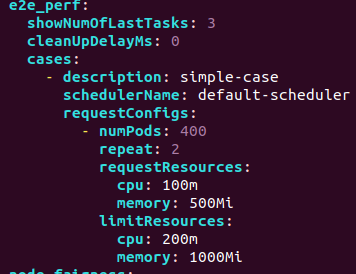
In this case,yunikorn and default scheduler will sequentially separately create ten deployments which contains fifty pods.
It will look like these.
Node fairness case
| Field | Description |
|---|---|
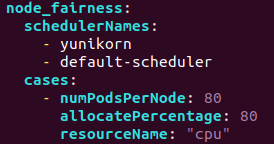
| SchedulerNames | List of schduler will run the test |
| NumPodsPerNode | It equals that total pods divided by nodes |
| AllocatePercentage | Allow how much percentage of allocatable resource is allowed to allocate |
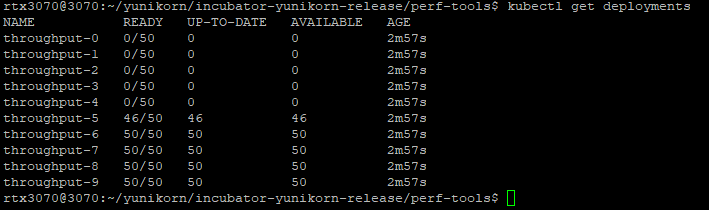
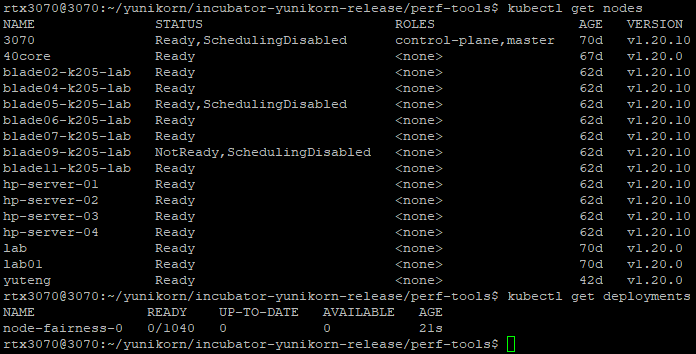
Total number of pods will be multiplication of number of ready nodes and NumPodsPerNode.
In following figure, there are thirteen ready nodes and NumPodsPerNode is eighty.
There will be one thousand fourty pods created.
e2e perf case
Its field is similar to throughput one but there is only scheduler in each case.

4. Diagrams and logs
./perf-tools
It will show result log when each case finished.
When tests finished, it will look like
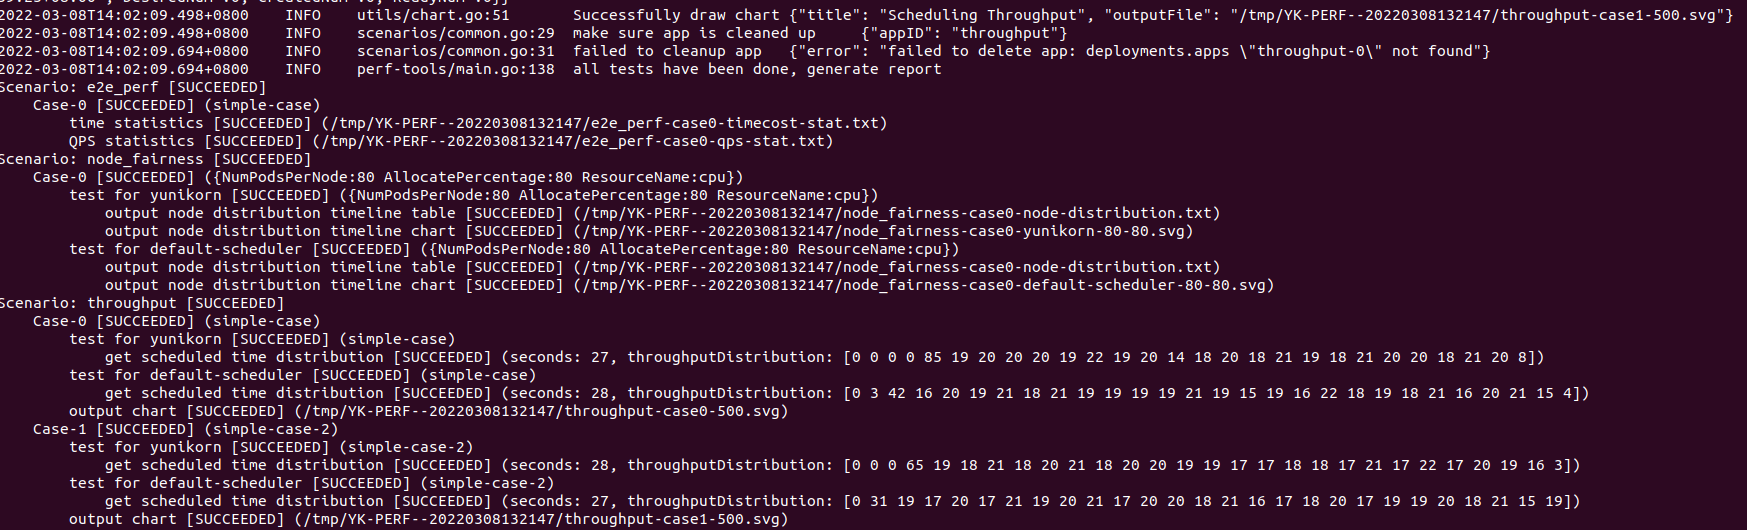 We can find result diagrams and logs in
 common.outputrootpath which is in conf.yaml.
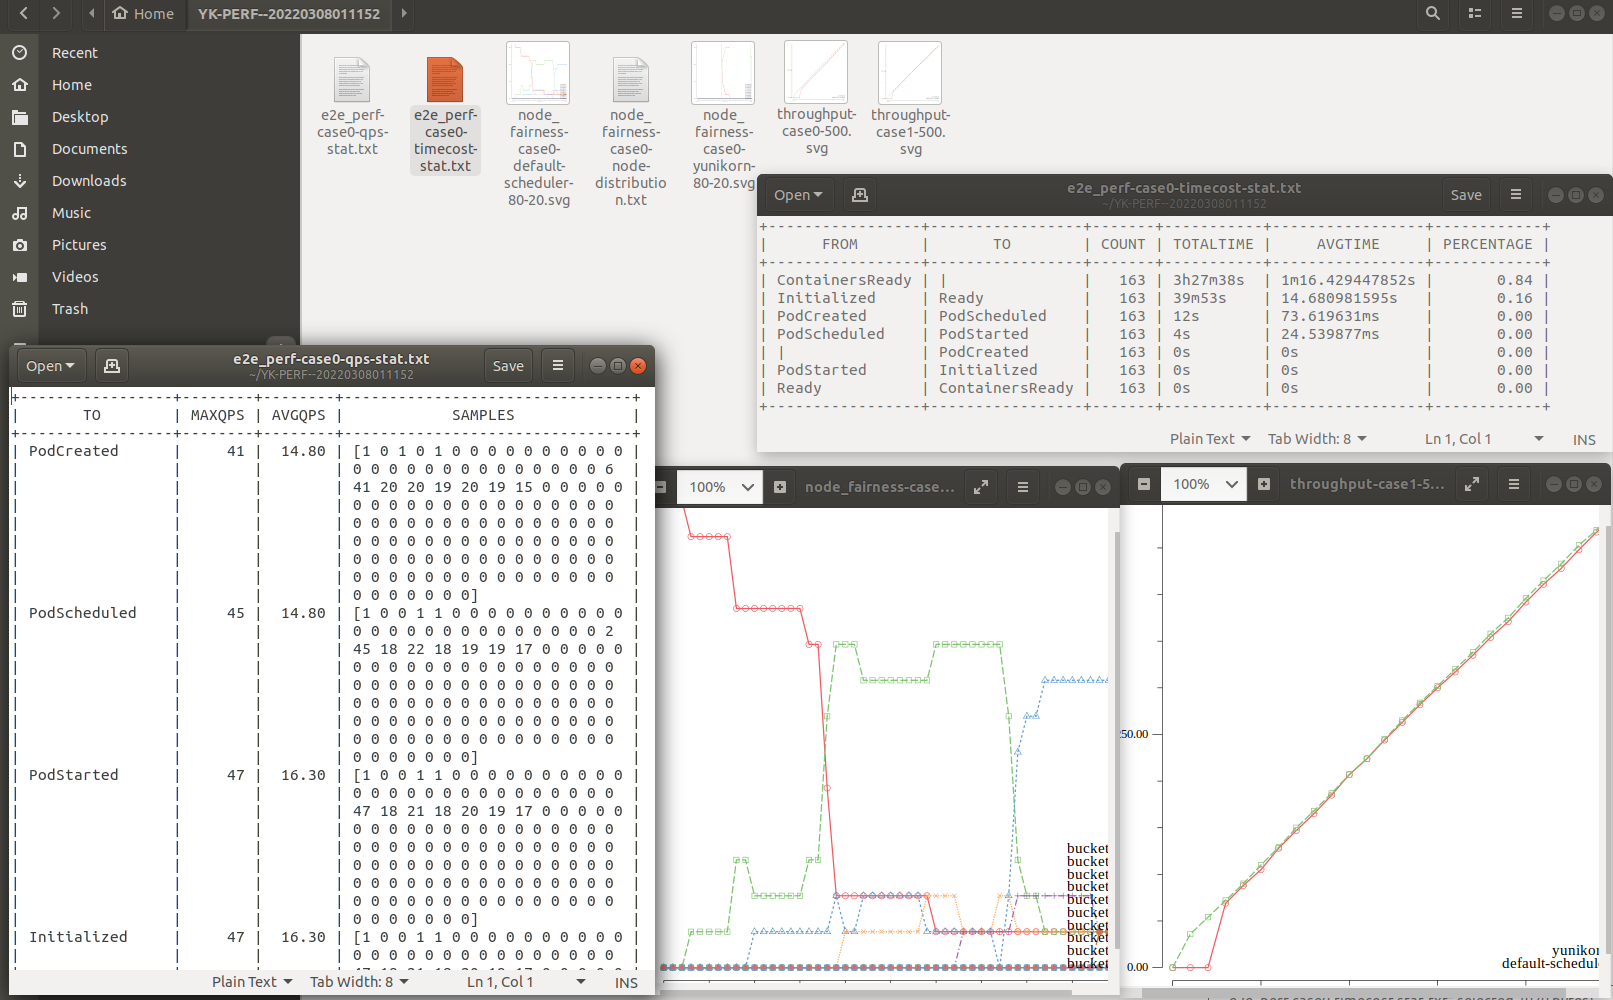
Related diagrams and logs will be like this.
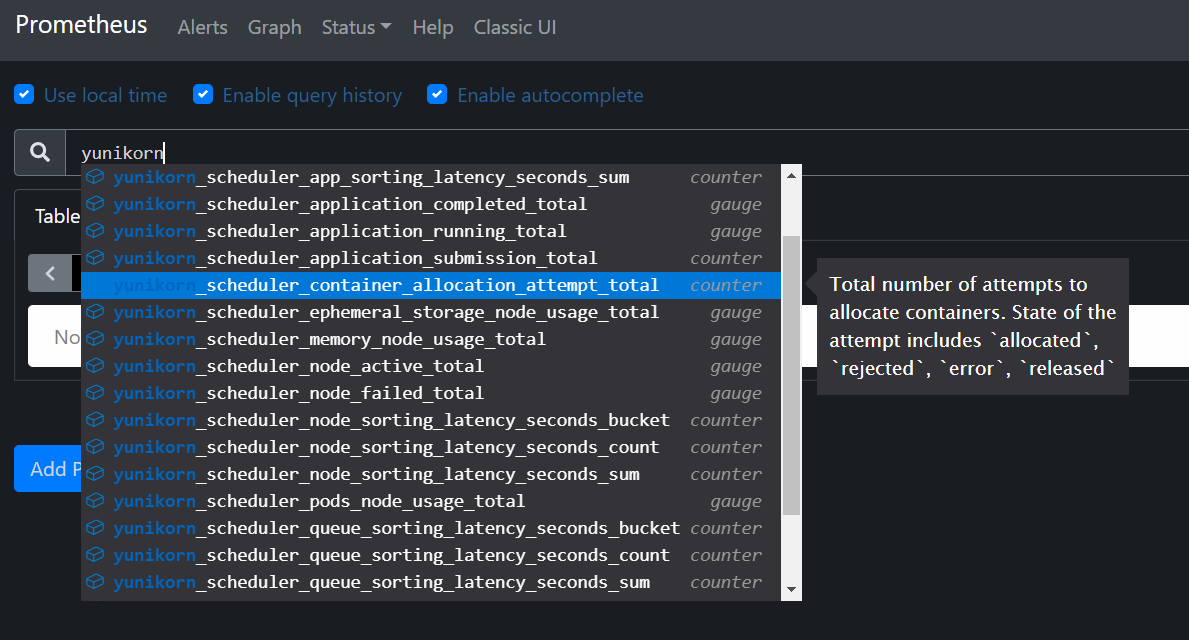
Collect and Observe YuniKorn metrics
After Prometheus is launched, YuniKorn metrics can be easily collected. Here is the docs of YuniKorn metrics. YuniKorn tracks some key scheduling metrics which measure the latency of some critical scheduling paths. These metrics include:
- scheduling_latency_seconds: Latency of the main scheduling routine, in seconds.
- app_sorting_latency_seconds: Latency of all applications sorting, in seconds.
- node_sorting_latency_seconds: Latency of all nodes sorting, in seconds.
- queue_sorting_latency_seconds: Latency of all queues sorting, in seconds.
- container_allocation_attempt_total: Total number of attempts to allocate containers. State of the attempt includes
allocated,rejected,error,released. Increase only.
you can select and generate graph on Prometheus UI easily, such as:
Performance Tuning
Kubernetes
The default K8s setup has limited concurrent requests which limits the overall throughput of the cluster. In this section, we introduced a few parameters that need to be tuned up in order to increase the overall throughput of the cluster.
kubeadm
Set pod-network mask
kubeadm init --pod-network-cidr=10.244.0.0/8
CNI
Modify CNI mask and resources.
  net-conf.json: |
    {
      "Network": "10.244.0.0/8",
      "Backend": {
        "Type": "vxlan"
      }
    }
  resources:
    requests:
      cpu: "100m"
      memory: "200Mi"
    limits:
      cpu: "100m"
      memory: "200Mi"
Api-Server
In the Kubernetes API server, we need to modify two parameters: max-mutating-requests-inflight and max-requests-inflight. Those two parameters represent the API request bandwidth. Because we will generate a large amount of pod request, we need to increase those two parameters. Modify /etc/kubernetes/manifest/kube-apiserver.yaml:
--max-mutating-requests-inflight=3000
--max-requests-inflight=3000
Controller-Manager
In the Kubernetes controller manager, we need to increase the value of three parameters: node-cidr-mask-size, kube-api-burst and kube-api-qps. kube-api-burst and kube-api-qps control the server side request bandwidth. node-cidr-mask-size represents the node CIDR. it needs to be increased as well in order to scale up to thousands of nodes.
Modify /etc/kubernetes/manifest/kube-controller-manager.yaml:
--node-cidr-mask-size=21 //log2(max number of pods in cluster)
--kube-api-burst=3000
--kube-api-qps=3000
kubelet
In single worker node, we can run 110 pods as default. But to get higher node resource utilization, we need to add some parameters in Kubelet launch command, and restart it.
Modify start arg in /etc/systemd/system/kubelet.service.d/10-kubeadm.conf, add --max-Pods=300 behind the start arg and restart
systemctl daemon-reload
systemctl restart kubelet
Summary
With Kubemark and Prometheus, we can easily run benchmark testing, collect YuniKorn metrics and analyze the performance. This helps us to identify the performance bottleneck in the scheduler and further eliminate them. The YuniKorn community will continue to improve these tools in the future, and continue to gain more performance improvements.