Loki
In this example, Loki, along with Promtail, is used to collect YuniKorn logs from the cluster. These logs are then visualized through a Grafana dashboard.
Modify YuniKorn settings
Follow YuniKorn install guide and modify YuniKorn configmap "yunikorn-defaults" to allow ray operator based on k8s service account.
kubectl patch configmap yunikorn-defaults -n yunikorn --patch '{"data":{"admissionController.accessControl.systemUsers": "^system:serviceaccount:kube-system:,^system:serviceaccount:meta:"}}'
Install Grafana
Install the Grafana Helm chart:
helm repo add grafana https://grafana.github.io/helm-charts
helm repo update
helm upgrade --install grafana grafana/grafana -n meta --create-namespace
Install Loki
- Create the
binary.yamlfile
#binary.yaml
loki:
  commonConfig:
    replication_factor: 1
  schemaConfig:
    configs:
      - from: 2024-04-01
        store: tsdb
        object_store: s3
        schema: v13
        index:
          prefix: loki_index_
          period: 24h
  ingester:
    chunk_encoding: snappy
  tracing:
    enabled: true
  querier:
    max_concurrent: 2

deploymentMode: SingleBinary
singleBinary:
  replicas: 1
  resources:
    limits:
      cpu: 1
      memory: 2Gi
    requests:
      cpu: 1
      memory: 2Gi
  extraEnv:
    # Keep a little bit lower than memory limits
    - name: GOMEMLIMIT
      value: 3750MiB

chunksCache:
  enabled: false
  # default is 500MB, with limited memory keep this smaller
  writebackSizeLimit: 10MB

resultsCache:
  enabled: false

# Enable minio for storage
minio:
  enabled: true

# Zero out replica counts of other deployment modes
backend:
  replicas: 0
read:
  replicas: 0
write:
  replicas: 0

ingester:
  replicas: 0
querier:
  replicas: 0
queryFrontend:
  replicas: 0
queryScheduler:
  replicas: 0
distributor:
  replicas: 0
compactor:
  replicas: 0
indexGateway:
  replicas: 0
bloomCompactor:
  replicas: 0
bloomGateway:
  replicas: 0
- Install the Loki Helm chart:
helm upgrade --install loki grafana/loki -n meta -f binary.yaml
Troubleshoot
If your Loki and Loki-minio pods remain pending, you need to delete them and wait for them to restart.
Install promtail
- Create the
promtail.yamlfile
#promtail.yaml
config:
  clients:
    - url: http://loki-gateway/loki/api/v1/push
      tenant_id: user
      external_labels:
        cluster: kind-cluster
- Install the promtail Helm chart:
helm upgrade --install promtail grafana/promtail -f promtail.yaml
Grafana settings to connect to Loki
1. Access the Grafana Web UI
kubectl port-forward -n meta service/grafana 3000:3000
After running port forwarding, you can access Grafana's web interface by localhost:3000 in your browser.
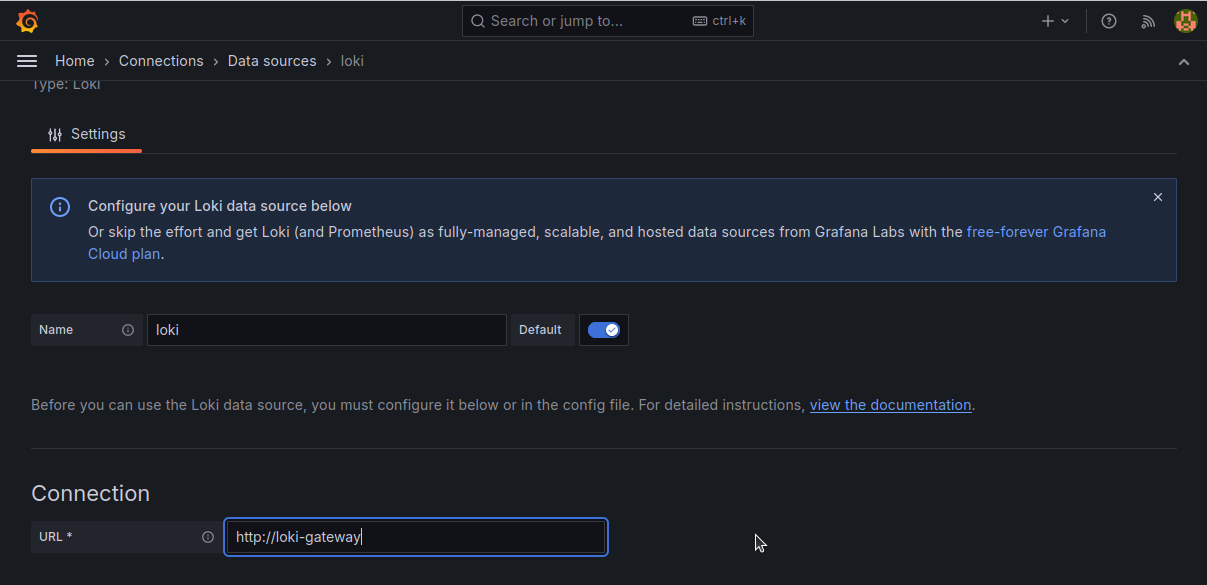
2. Set URL and HTTP headers
In grafana, adding a loki data source with url and http headers allows grafana to fetch logs.
set URL field http://loki-gateway
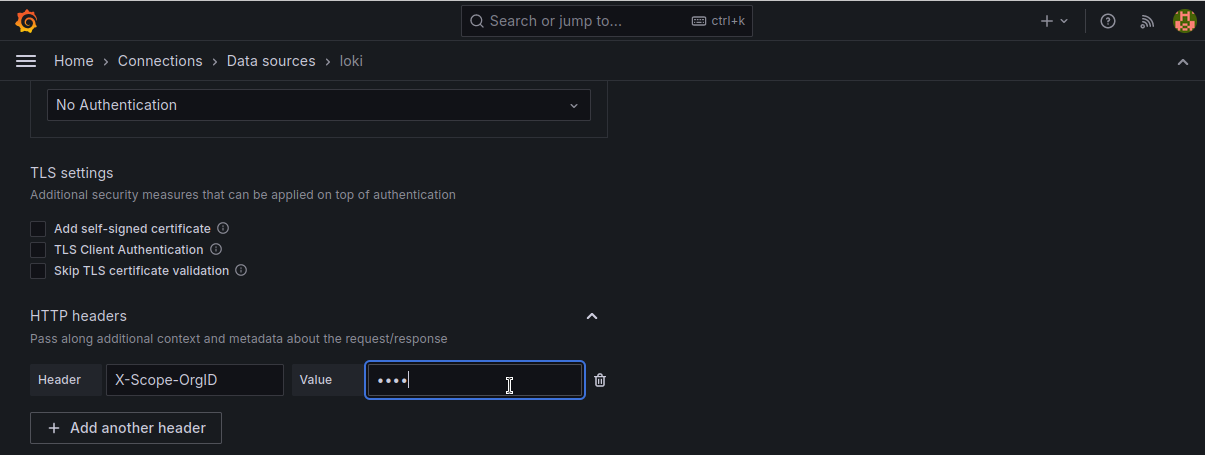
In order to fetch logs from promtail which tenantID is user, set HTTP headers field X-Scope-OrgId with user.
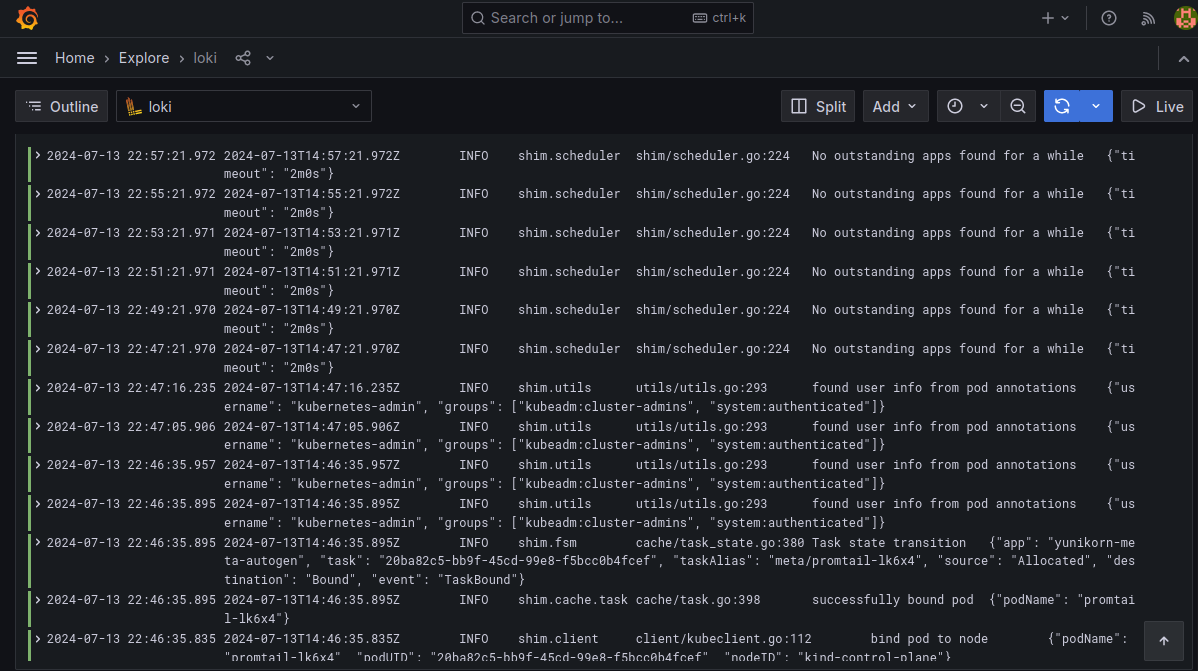
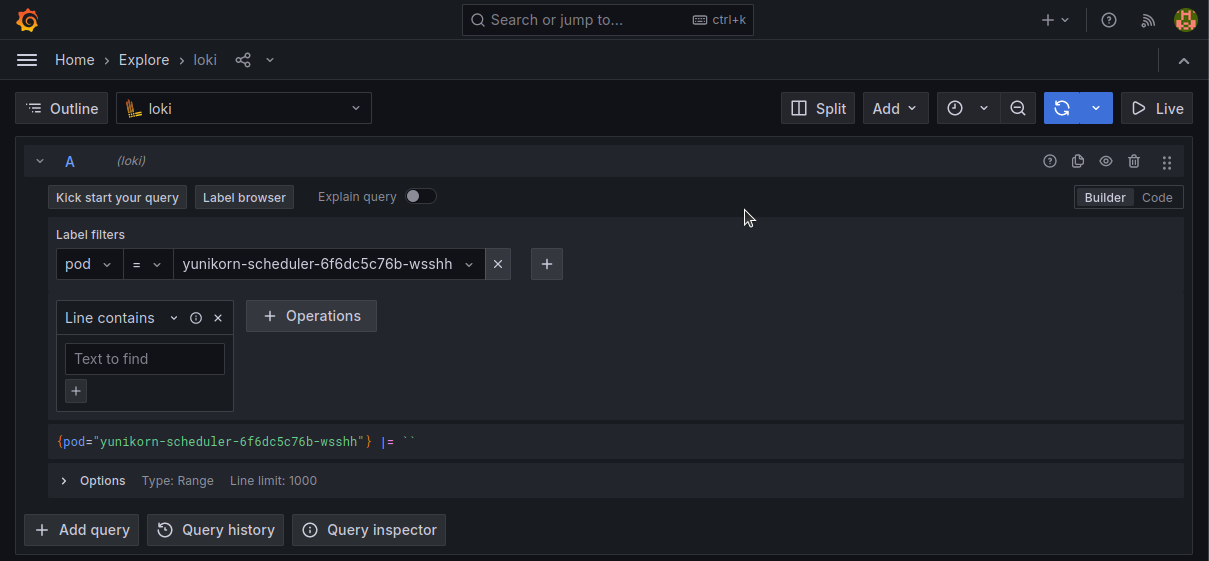
Loki log result
- Set tracking target
- bar chart
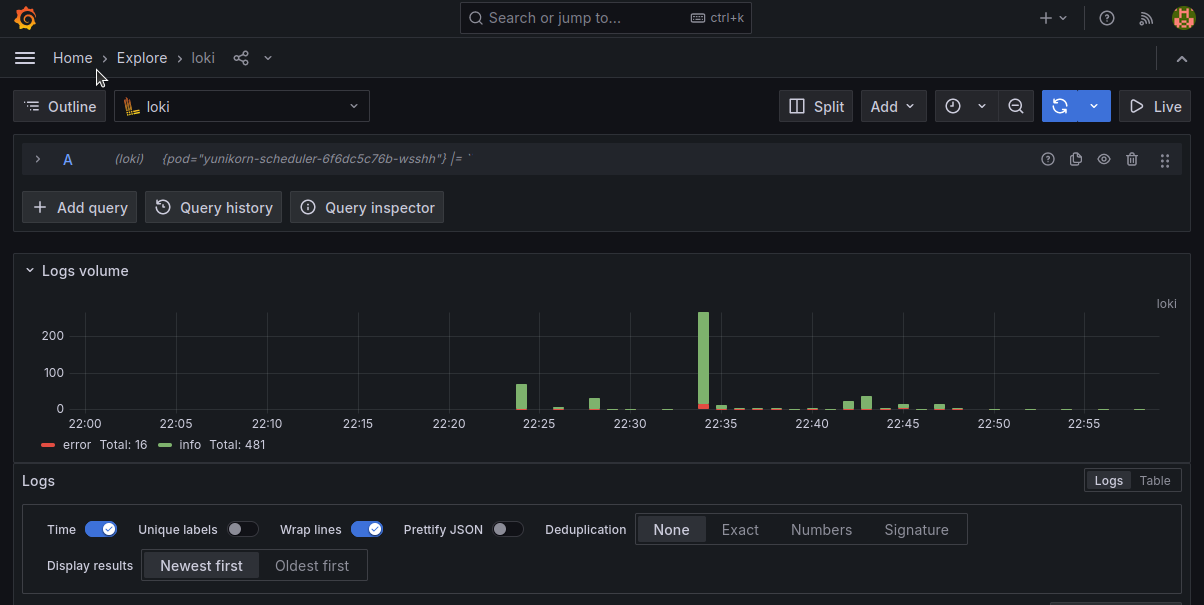
- INFO log